HELP - An Overview of the HARP Database
HARP is designed for research purposes and includes the following features:
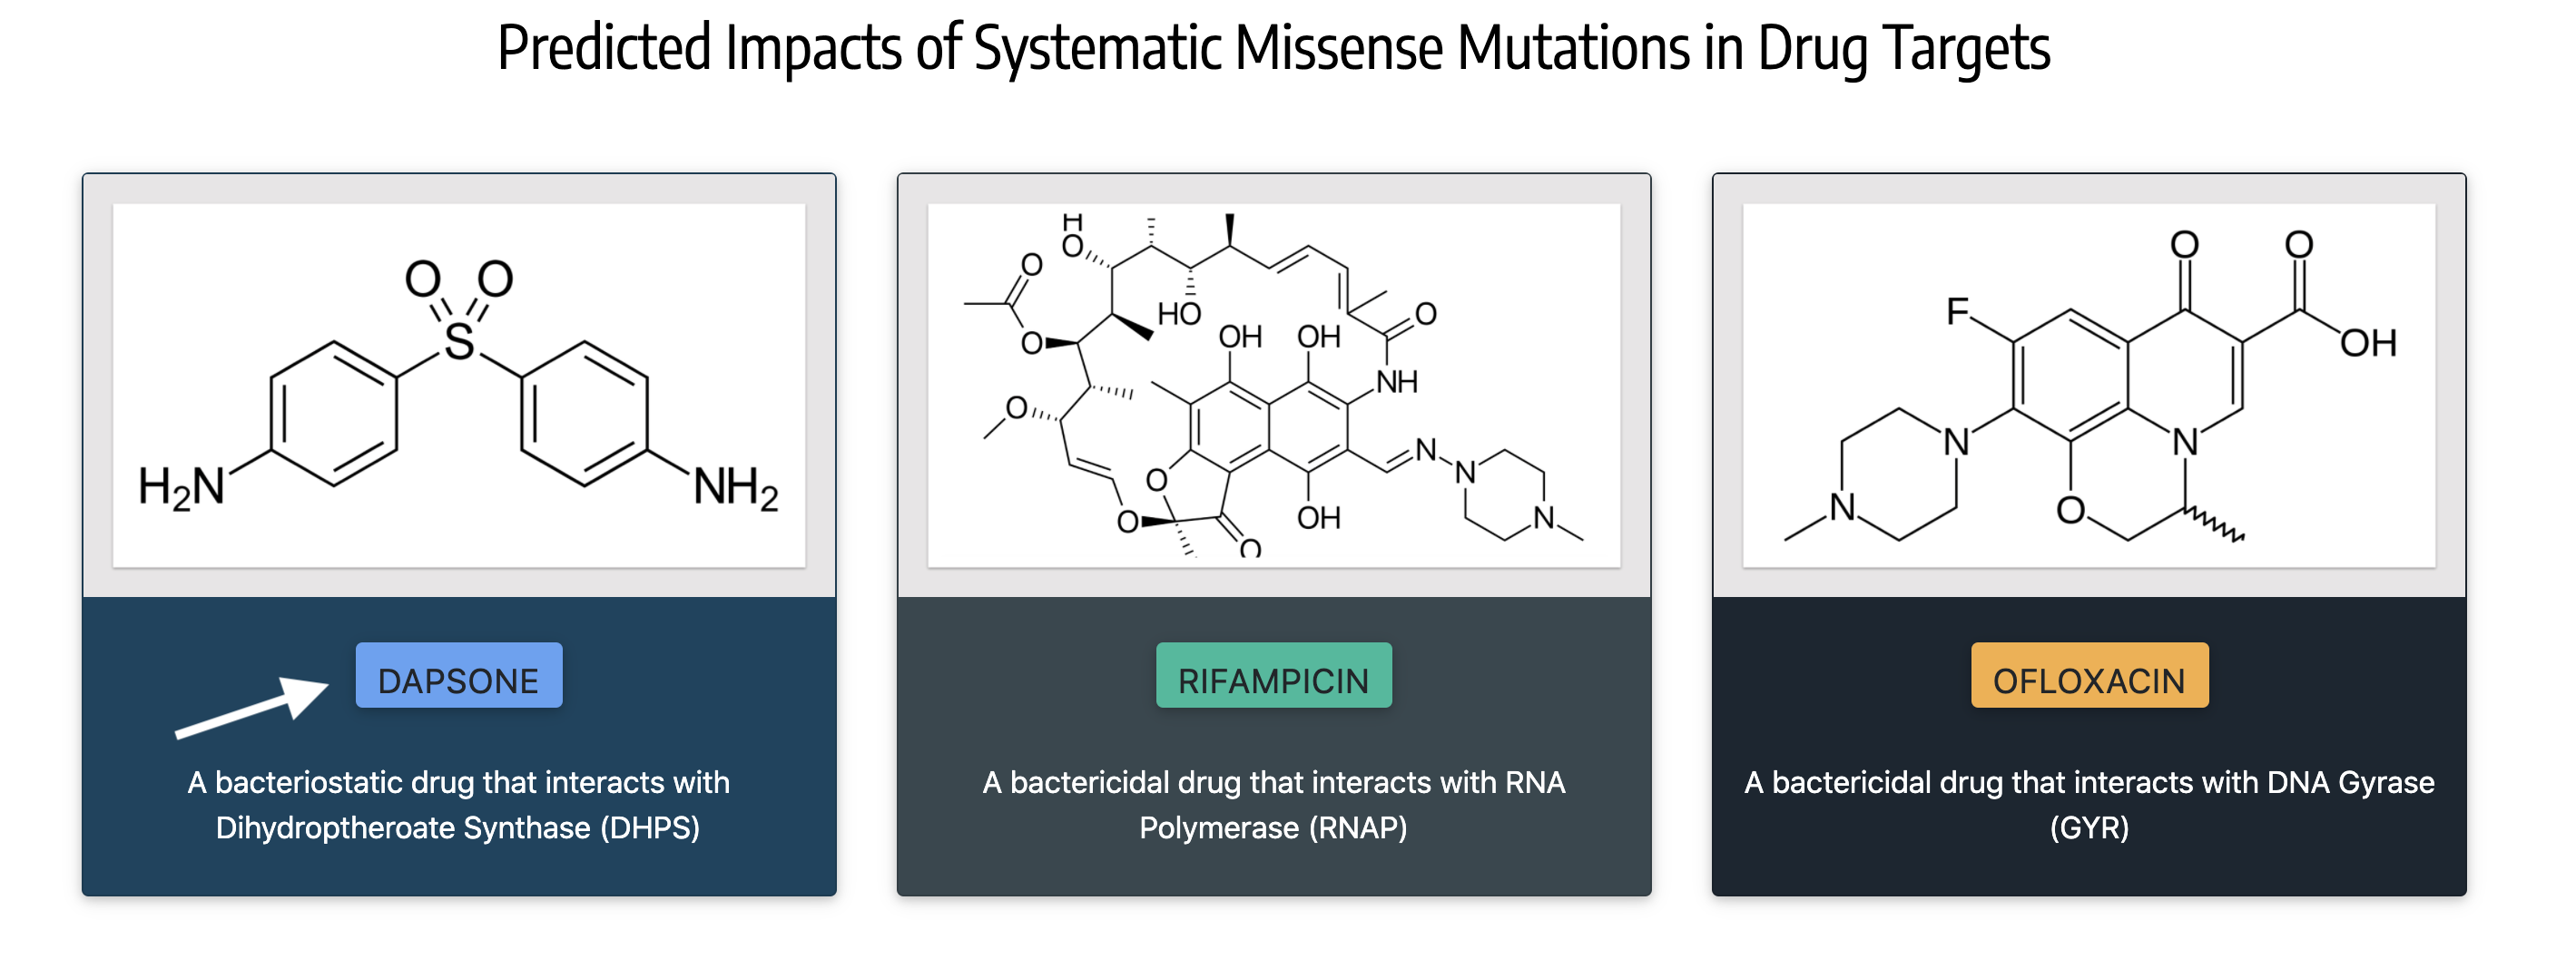
HARP (a database of Hansen's Disease Antimicrobial Resistance Profiles) is a collection of predicted structural impacts (with citations to published mutations) of missense mutations in drug-targets for dapsone, rifampicin and Ofloxacin, that confer antimicrobial resistance in leprosy. The three drug-targets in Mycobacterium leprae, namely Dihydroptheroate Synthase (DHPS), RNA Polymerase (RNAP) and DNA Gyrase (GYR) are modelled using homologous protein structures from Mycobacterium tuberculosis. Every amino acid residue in each of these drug targets is mutated to all the other 19 possibilities, and the impacts of the mutations were measured using various sequence and structure-based predictors, and tools that determine vibrational entropy changes due to mutations.
Citation:
Vedithi SC, Malhotra S, Skwark MJ, Munir A, Acebrón-García-De-Eulate M, Waman VP, Alsulami A, Ascher DB, Blundell TL. HARP: a database of structural impacts of systematic missense mutations in drug targets of Mycobacterium leprae. Computational and Structural Biotechnology Journal. 2020 Nov 19, doi: https://doi.org/10.1016/j.csbj.2020.11.013
Querying the Database:
Modelled Regions:
DHPS: The model of DHPS homodimer was built using multistep protein modelling pipeline (Vivace). The modelled region follows the UniProt's amino acid (residue) sequence numbering (for Gene Id: ML0224) from 5 to 278 in Chain A. Since DHPS model is a homodimer, mutations can be queried only in chain A.(Refer PMID: 25833404).
RNAP: The heterohexameric model of RNAP was built using Vivace (see above) and each chain was modelled as follows: (Refer PMID:32042379)
Chain A -(rpoA -ML1957) - Modelled from 3 to 226 residues.
Chain B -(rpoA' -ML1957) - Modelled from 6 to 231 residues.
Chain C -(rpoB -ML1891) - Modelled from 28 to 1153 residues.
Chain D -(rpoC -ML1890) - Modelled from 3 to 1281 residues.
Chain E -(rpoZ -ML0542) - Modelled from 28 to 108 residues.
Chain F -(rpoT -ML1022) - Modelled from 253 to 574 residues.
GYR: The heterotetrameric model of DNA Gyrase (GYR) of Mycobacterium leprae was modelled using PDB ID: 5BS8 as the template. The protein complex (GyrA2, GyrB2) is encoded by two genes namely gyrA and gyrB.
Chain A -(gyrA -ML0006) - Modelled from 16 to 501 residues. The intein region from residue positions 131-550 (UniProt sequence numbering) has been removed and residue numbering was made consistent with the PDB ID:5BS8
Chain B -(gyrB -ML0005) - Modelled from 440 to 678 residues.
Querying Mutations:
Mutations can be queried from the home page by clicking on the "Mutations" dropdown menu and by selecting the appropriate drugs:

or by clicking on the names of the drugs as shown in the figure below:
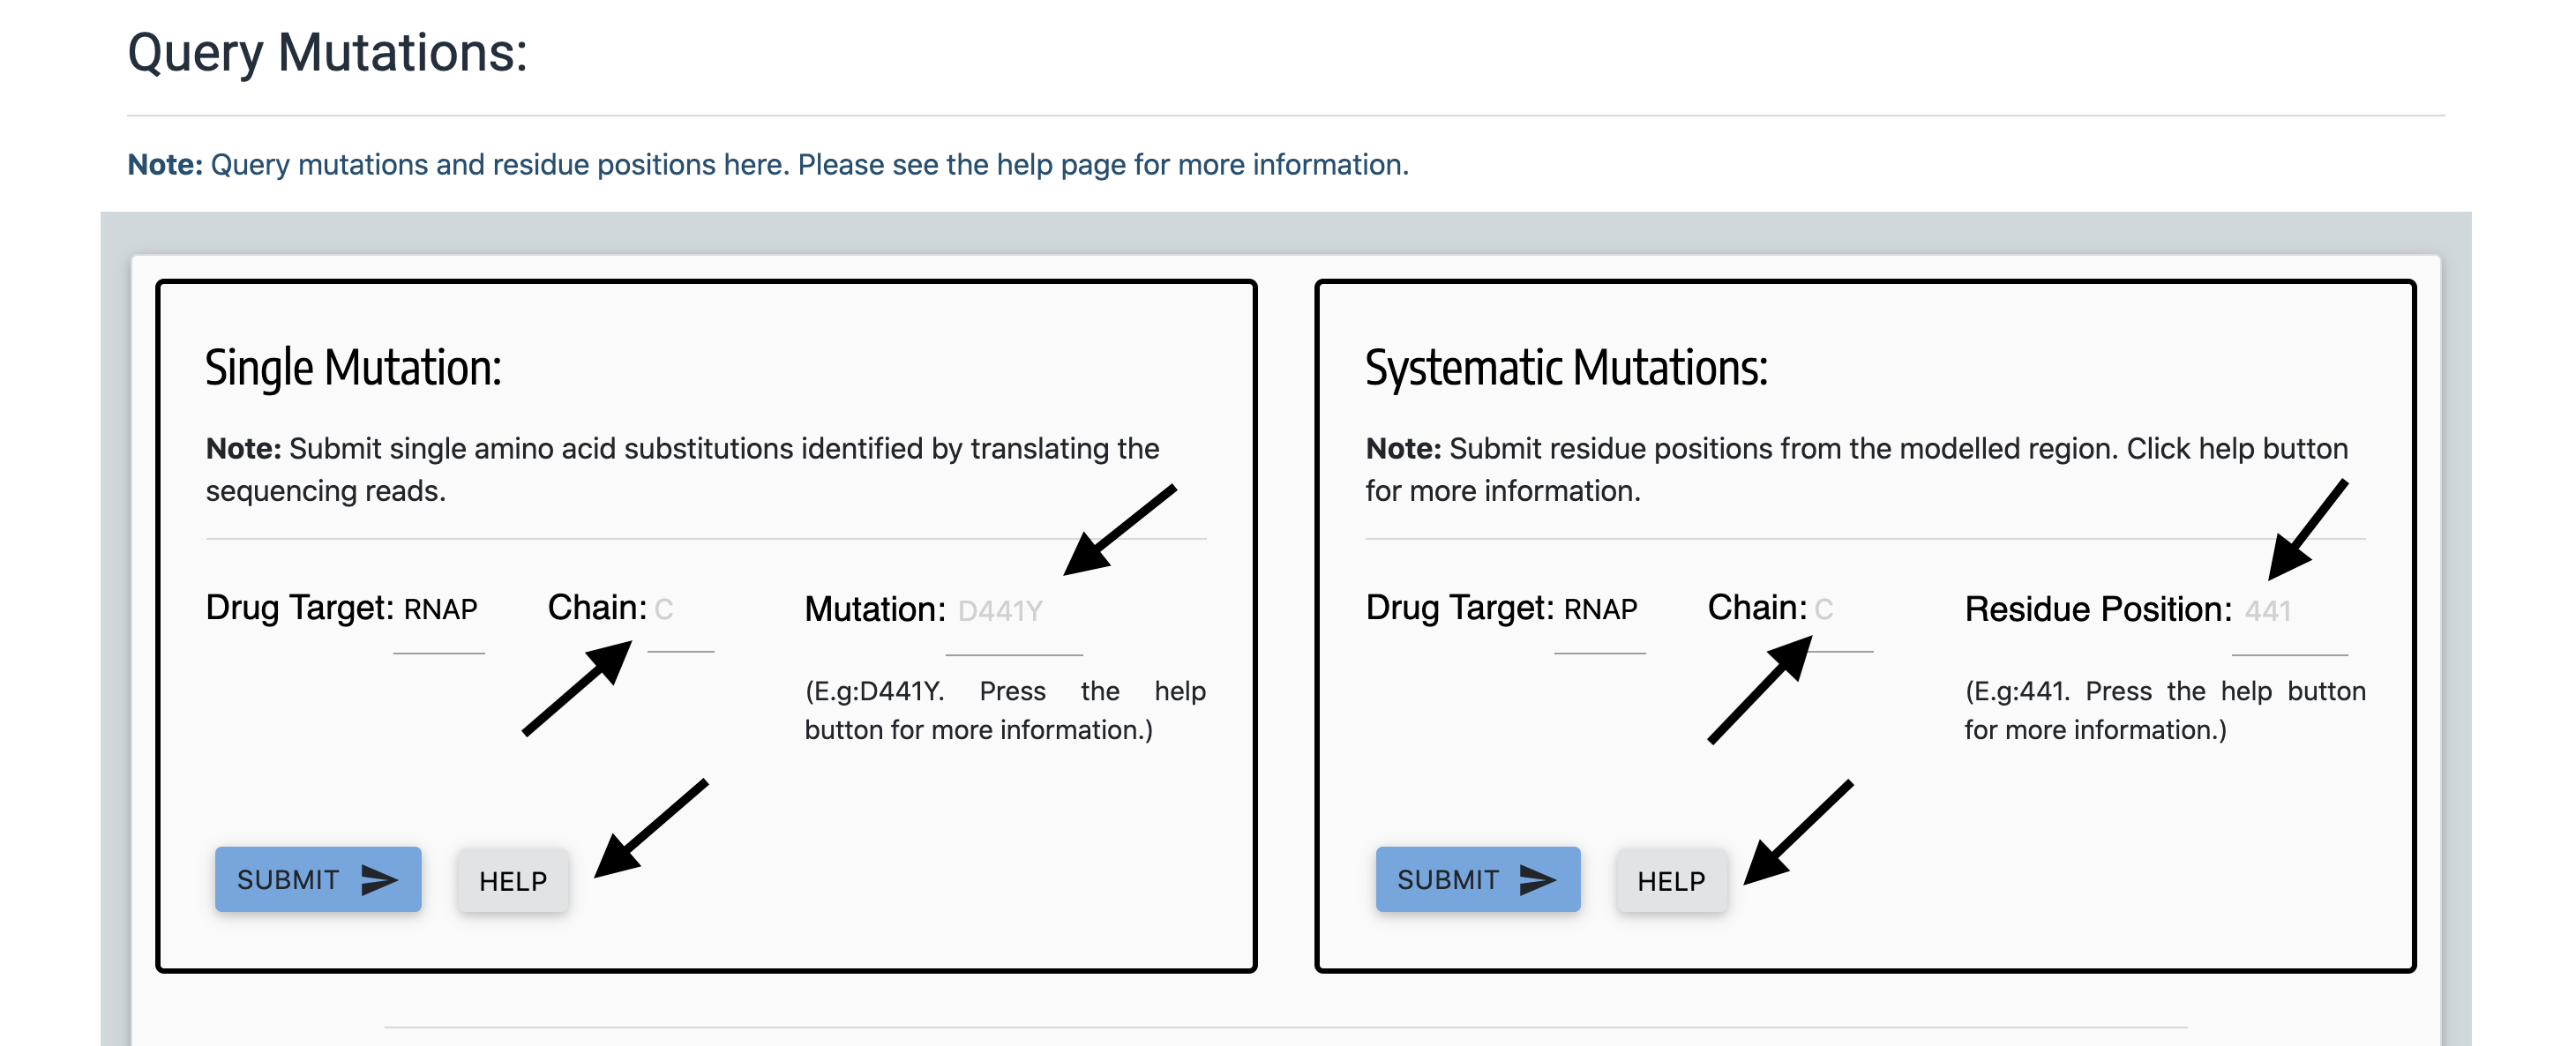
On the 'Query Mutations' page for each of the drug-target, mutations can be searched using the pattern - uppercase alphabet for the corresponding chain (Eg: C), wildtype aminoacid (single letter residue code in uppercase), residue position and mutant amino acid (single letter residue code in uppercase). Eg: D441Y for aspartic acid to tyrosine substitution mutation at position 441. Alternatively, only the residue position can be queried by entering the appropriate position number in the 'residue position' field of the 'Systematic Mutations' form. To identify the drug-target regions that are modelled, please see the "Modelled Region" section above or click on the "HELP" buttons in the 'Query Mutations' page.
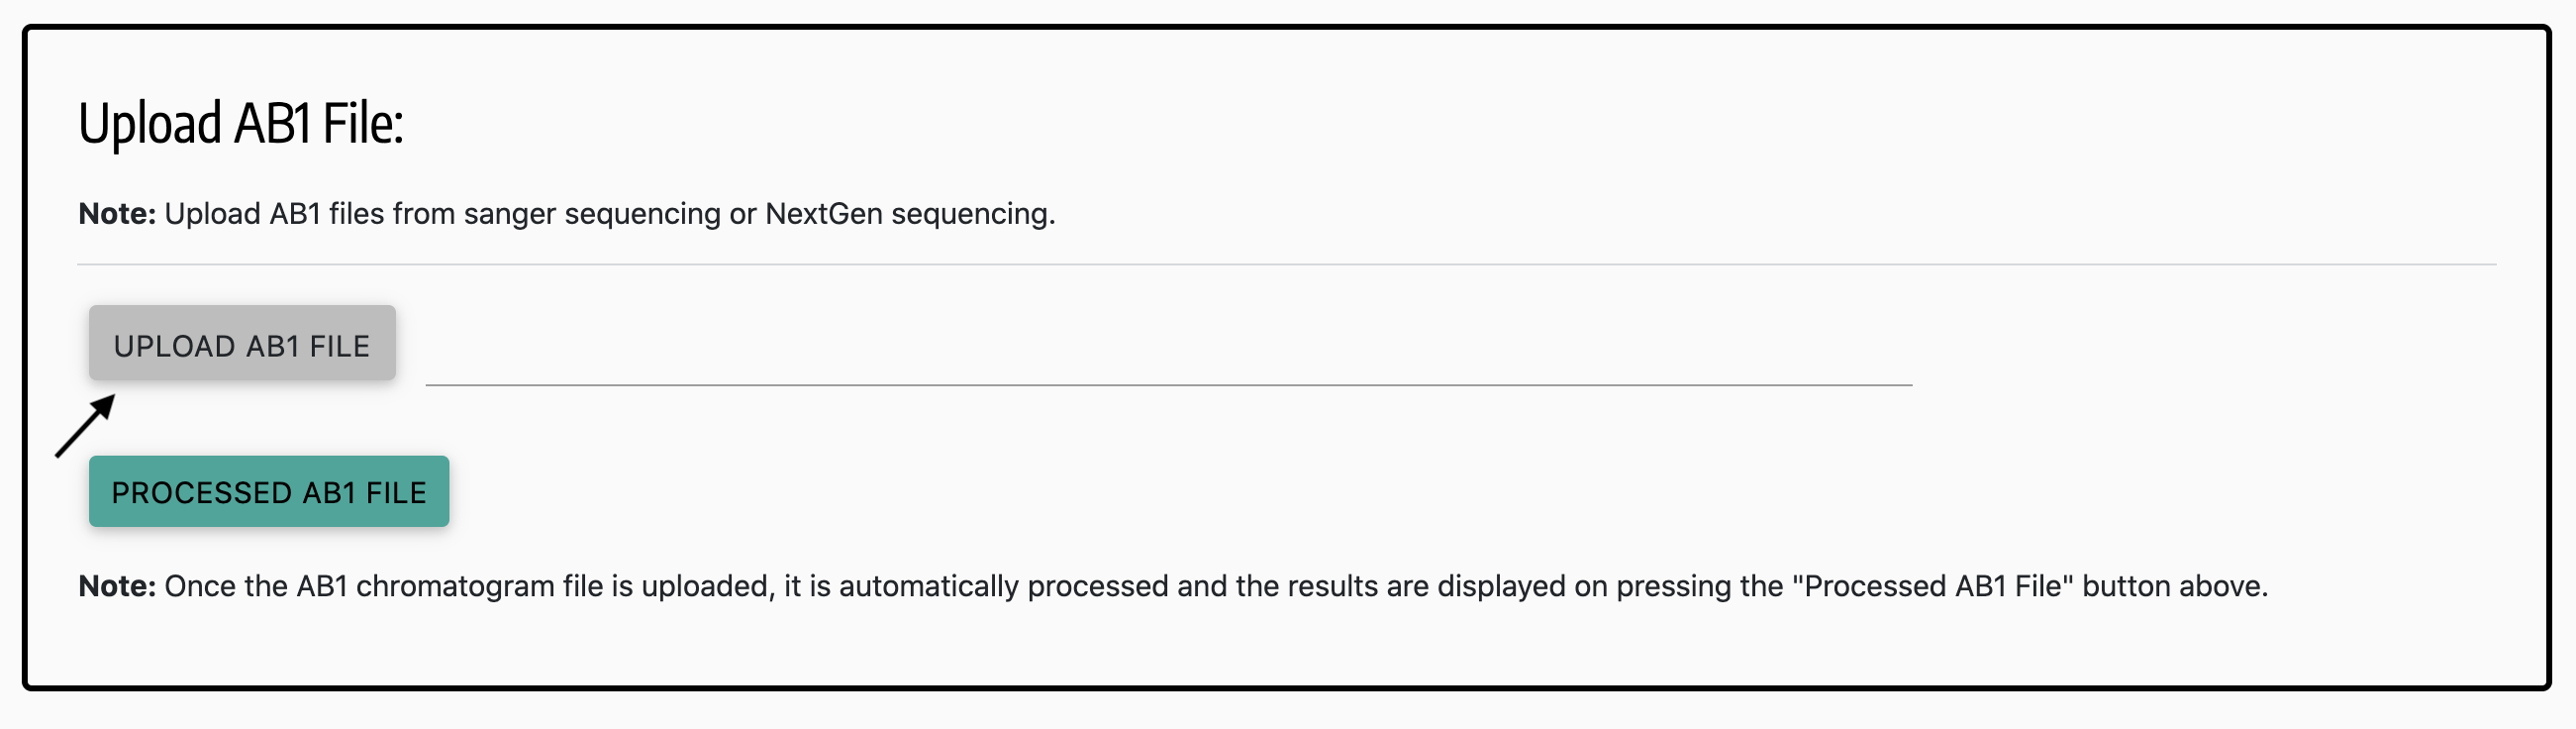
The ab1 (Chromatogram files) can be uploaded at the "Upload Ab1 File" panel (figure below) and processed AB1 files can be visualised by clicking the "Processed ABI File" button. The file can be uploaded by clicking on the "Upload AB1 File" button and by selecting the appropriate file. The file will be uploaded instantaneouly and browser will return the same query page. To view the results, click on the "Processed AB1 File" button.
The results are shown in a pop-up window (figure below):
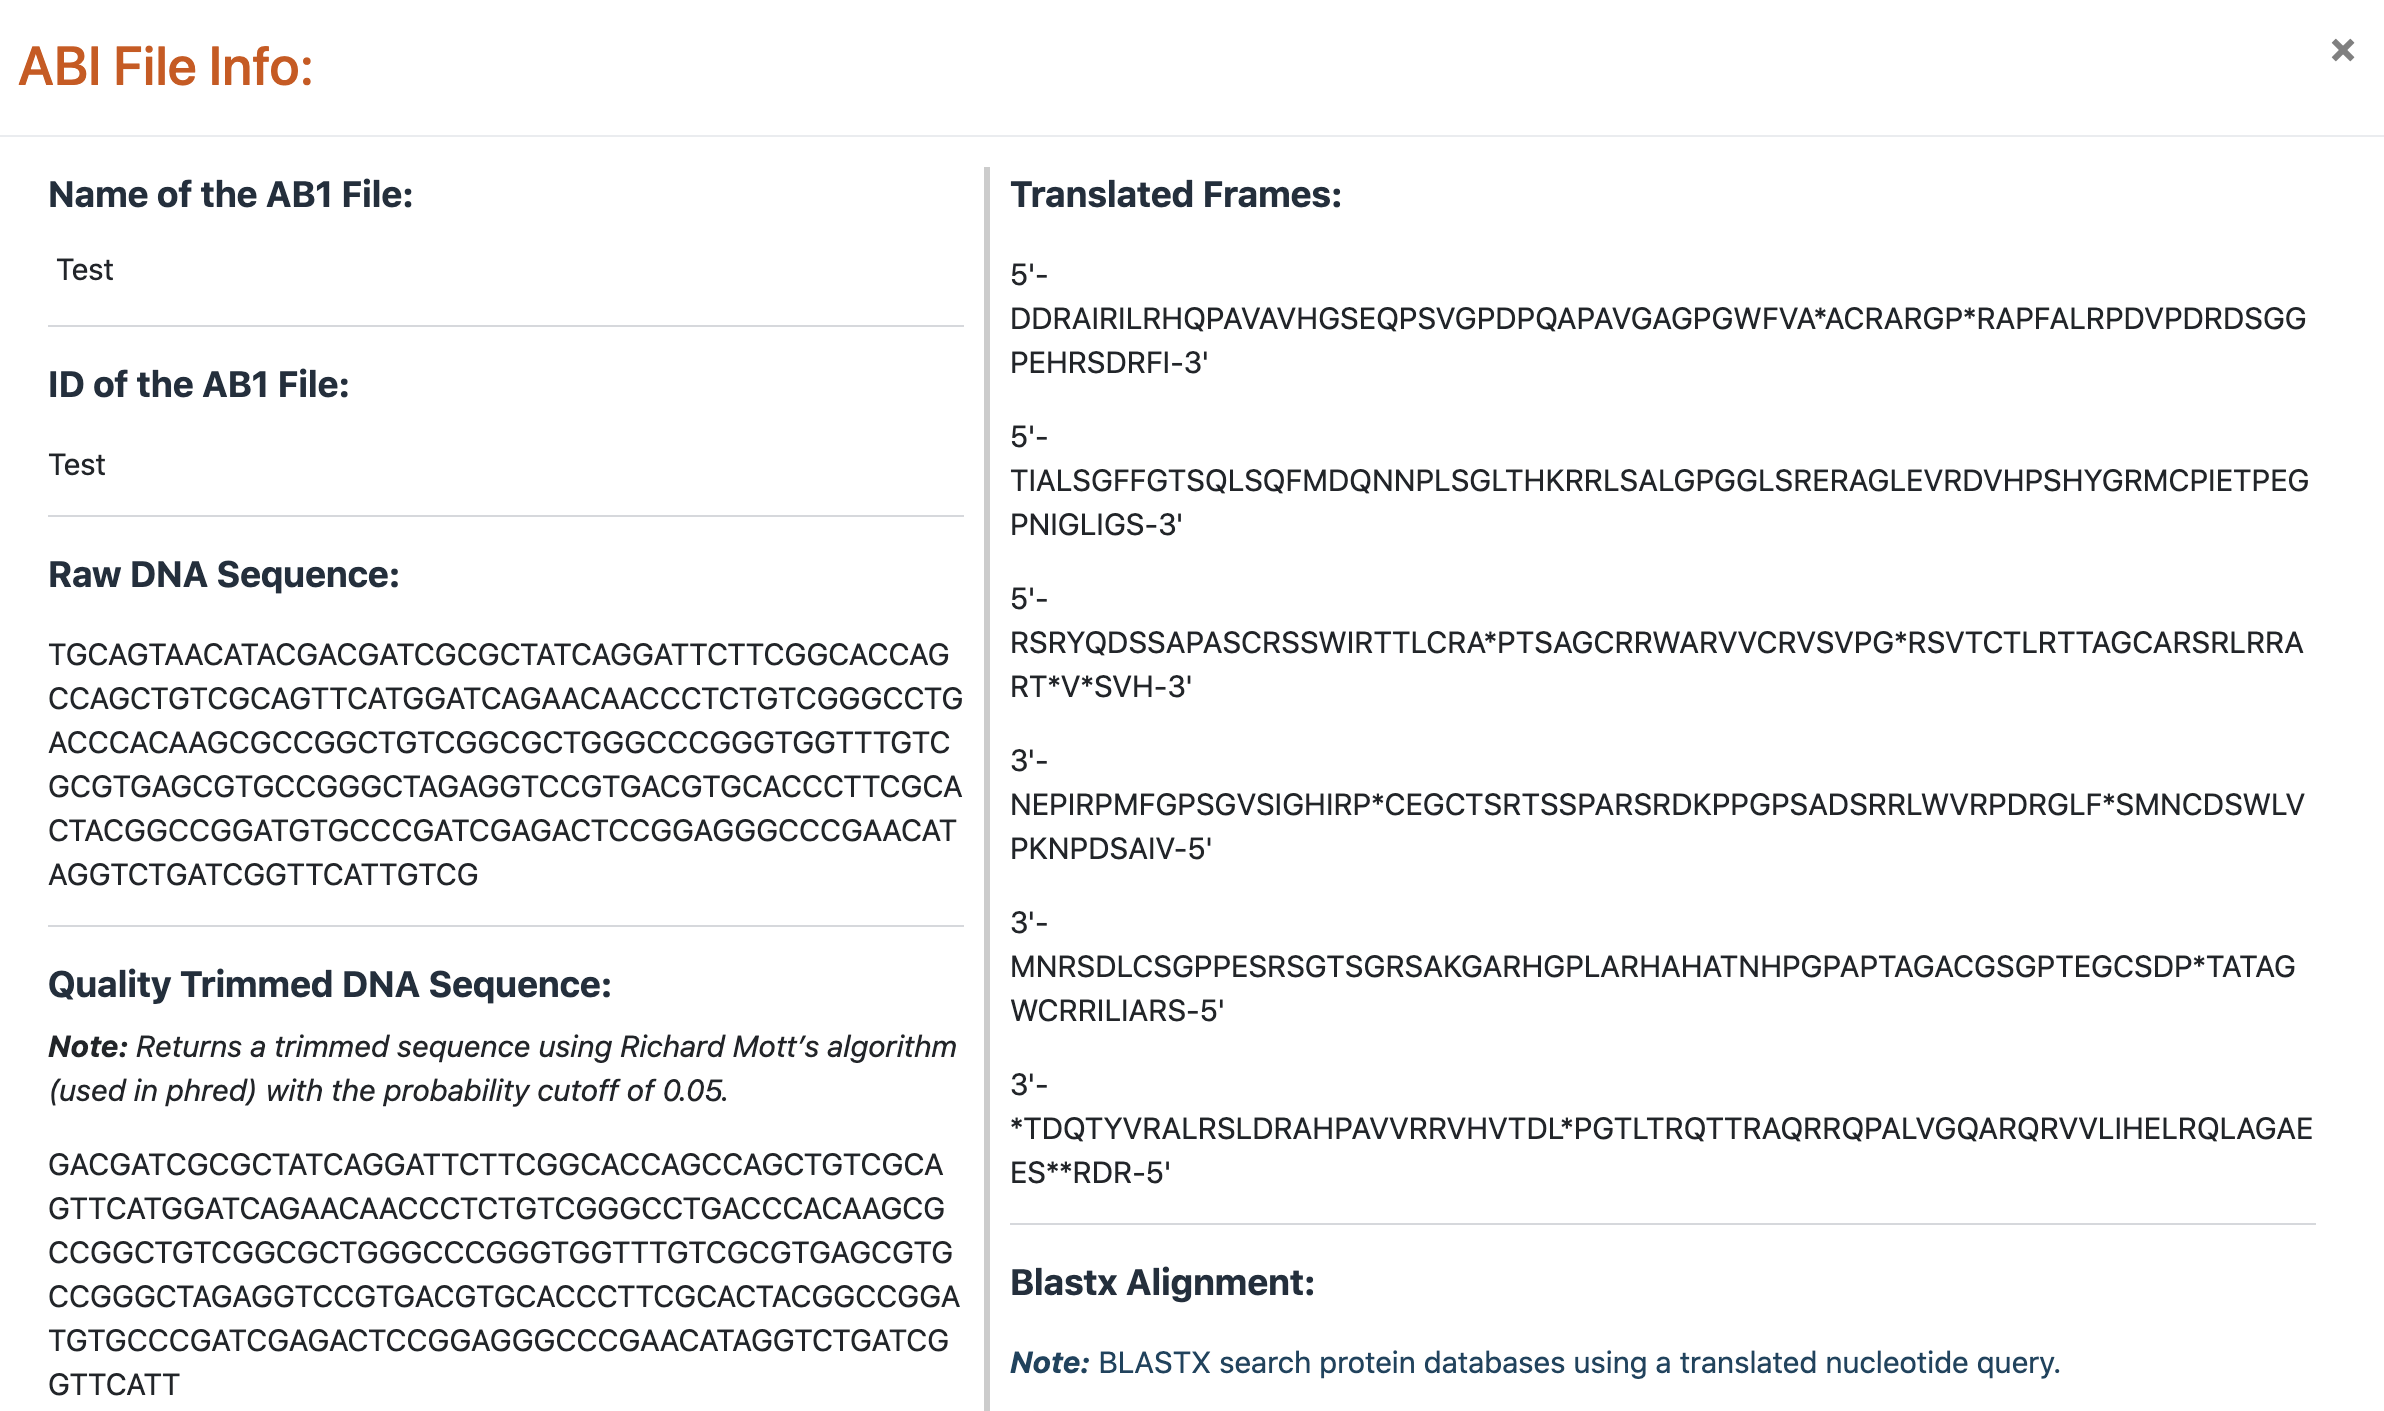
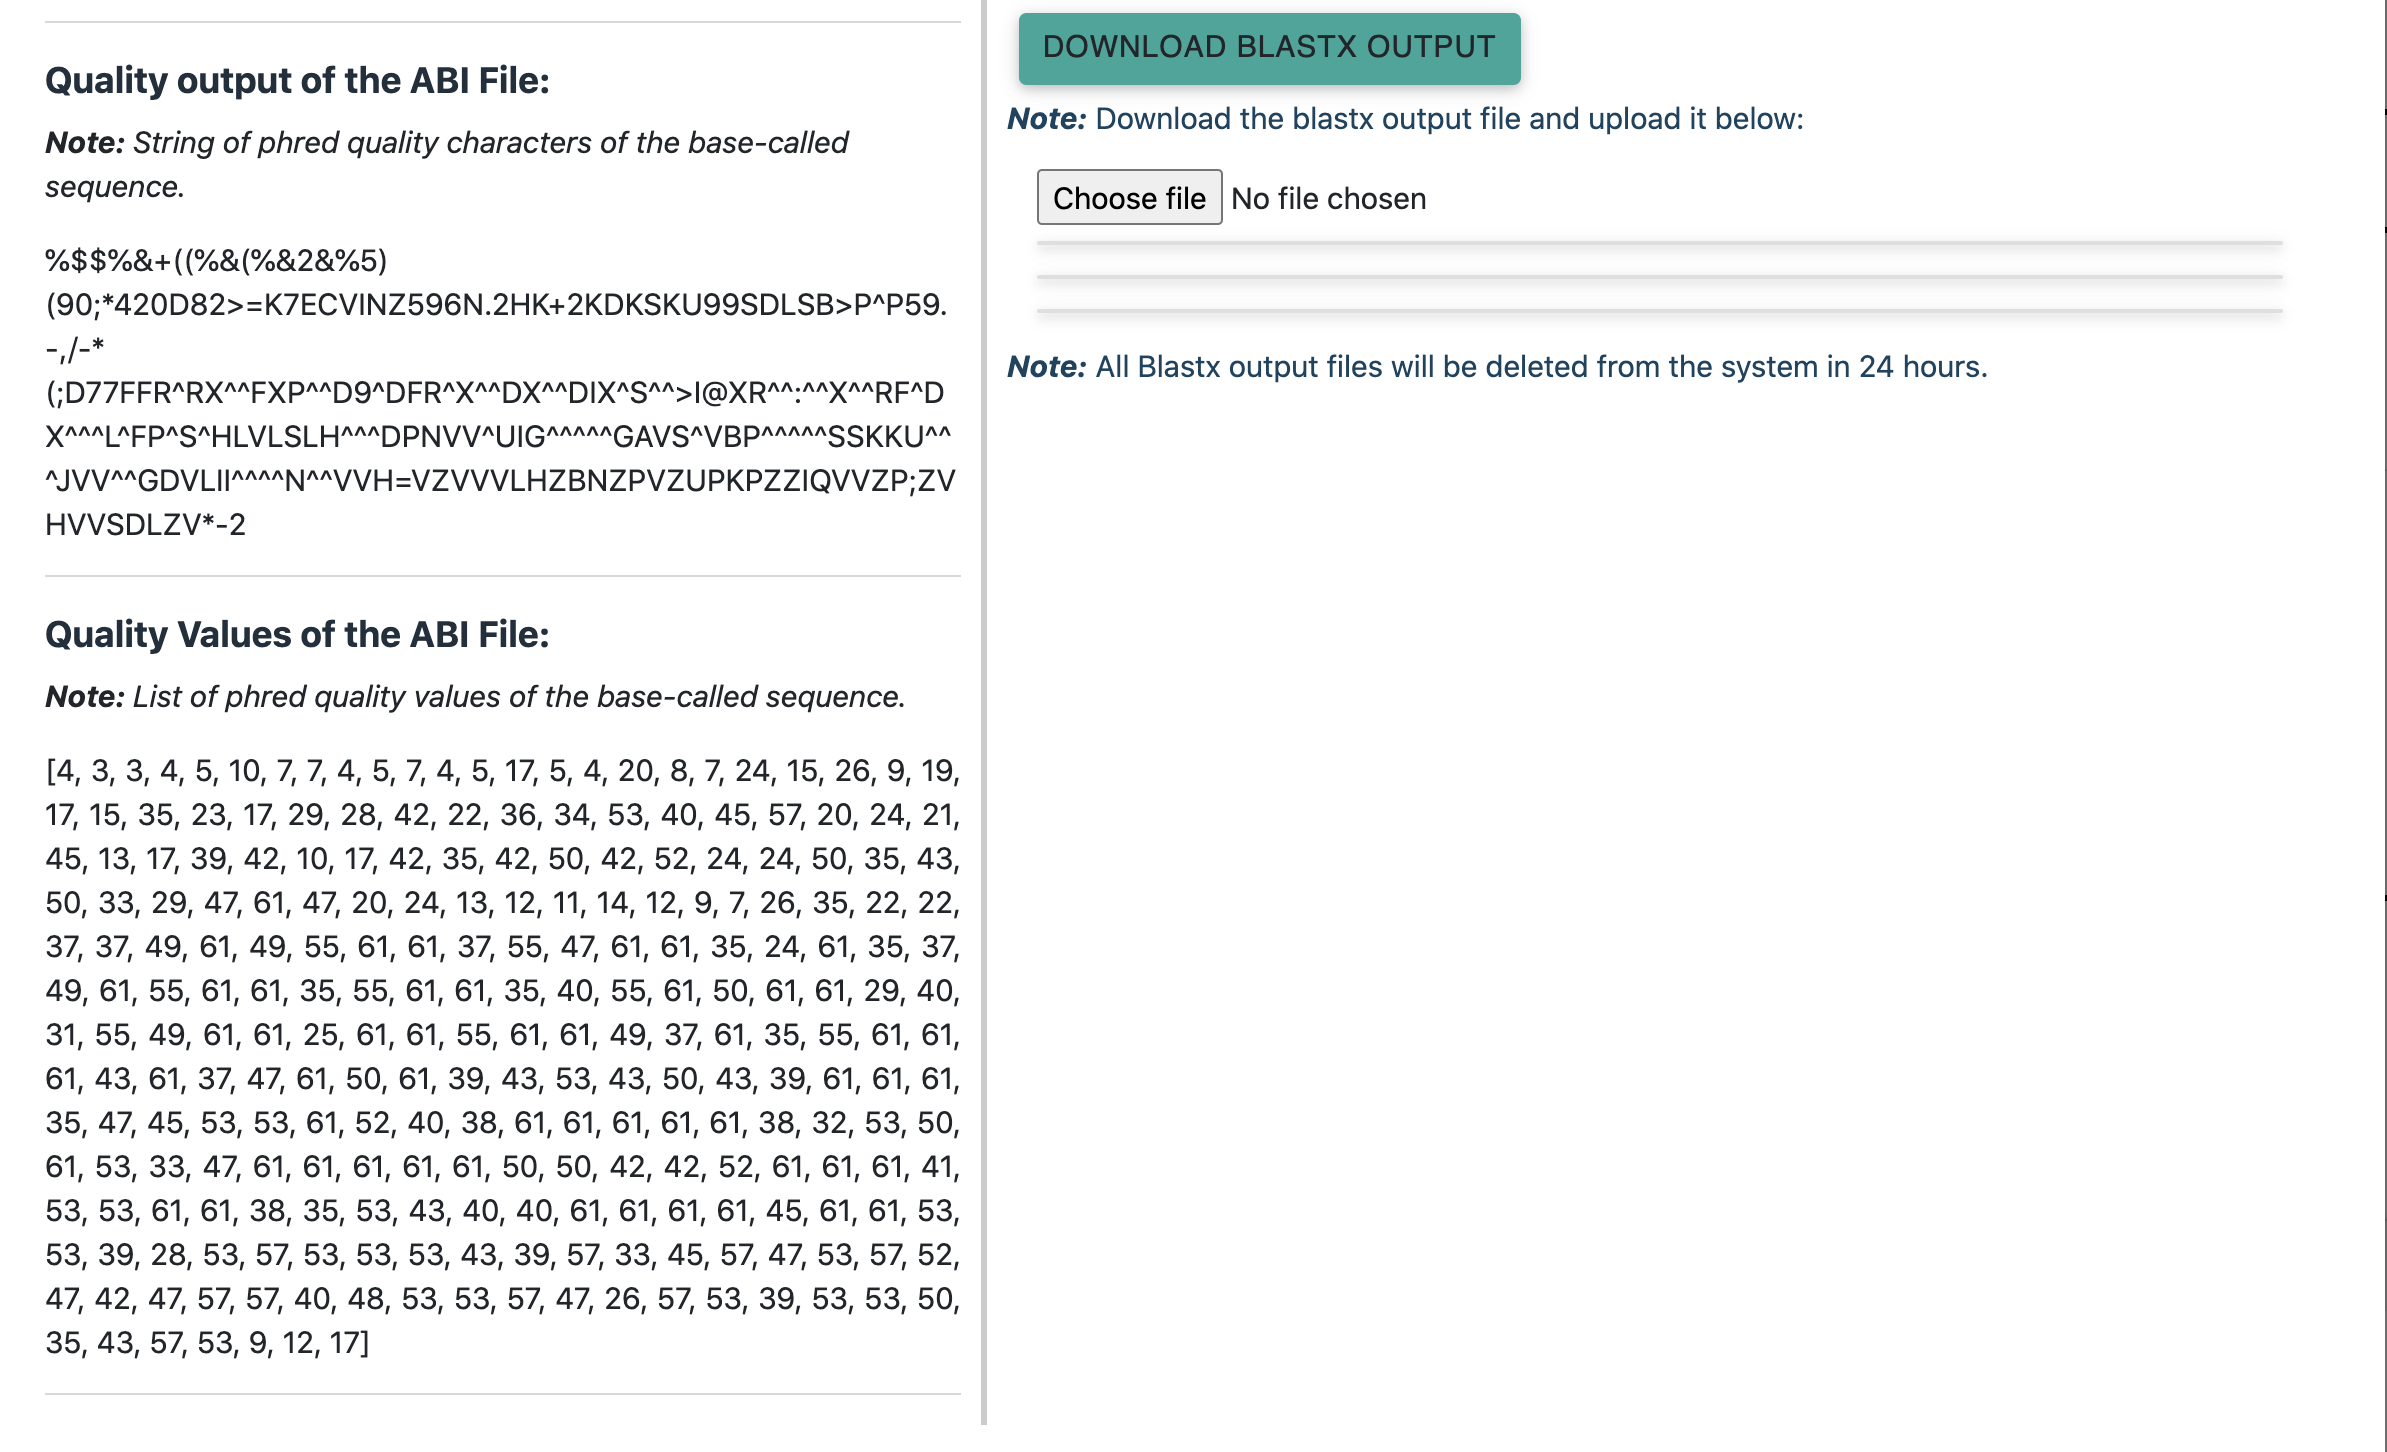
The results pop-up window has the following information:
- Name and identity of the AB1 file
- Raw and quality trimmed DNA sequences
- Translated frames
- Blastx results after aligning translated DNA sequences to protein sequences of all the three drug-target proteins.
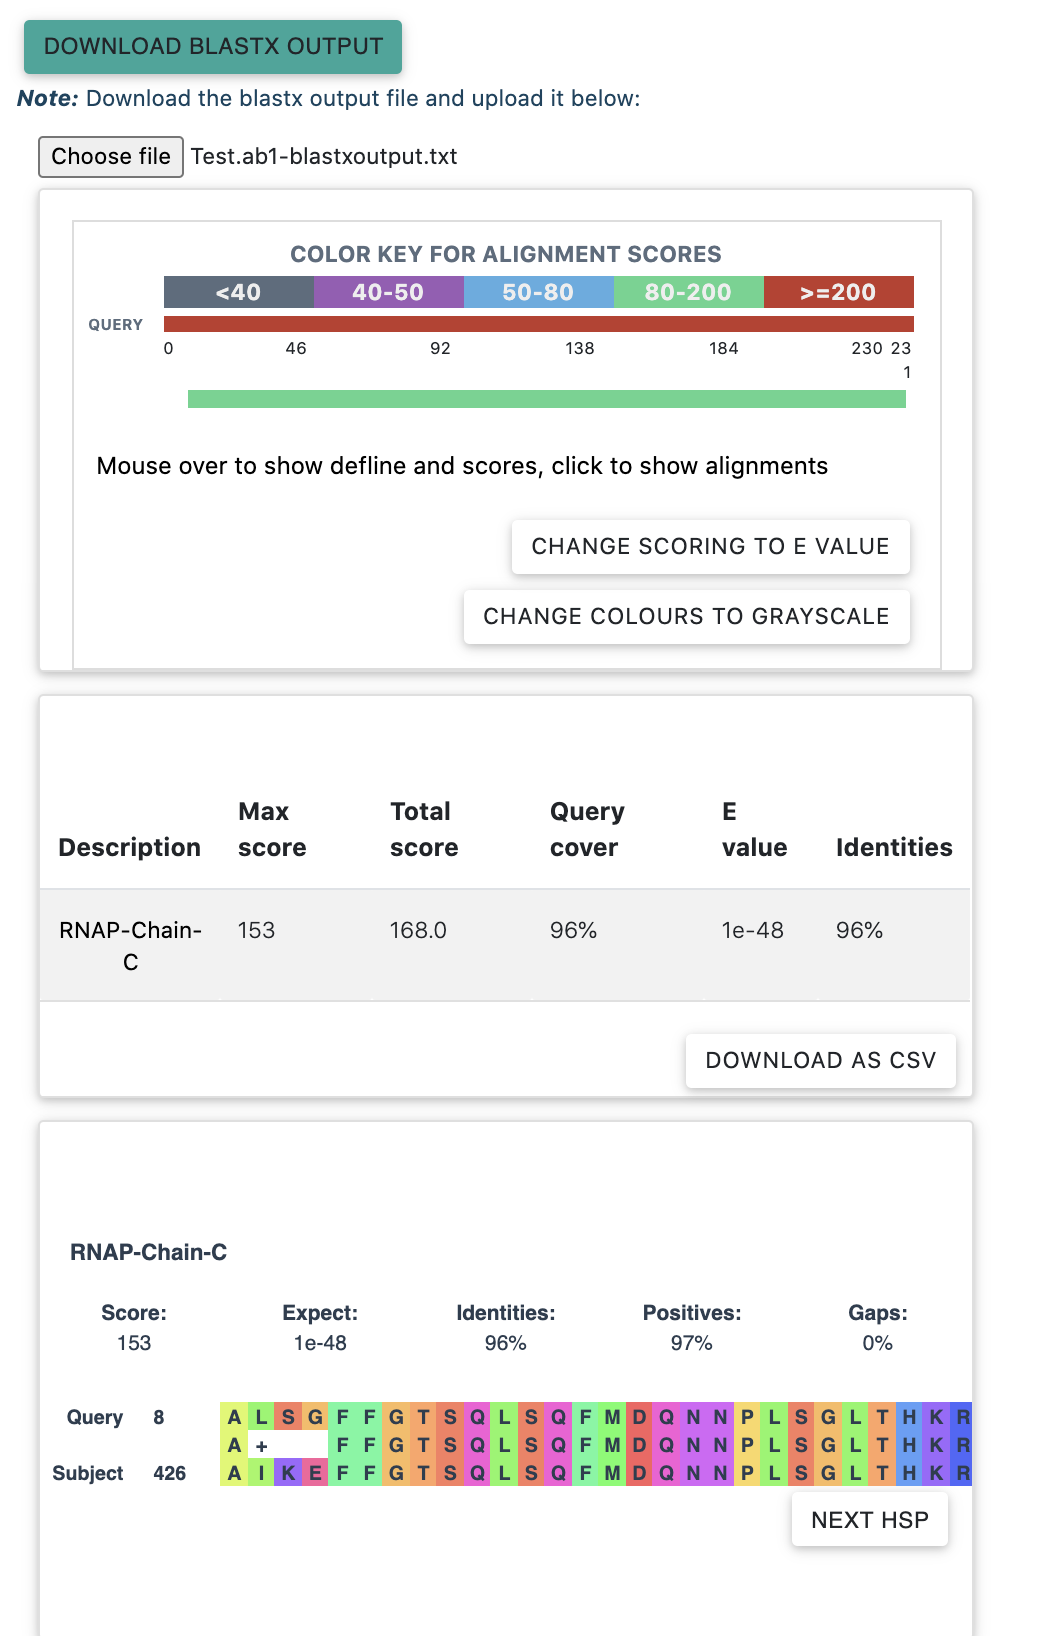
To view the Blastx results, download the blastx output file (by clicking on the "Download Blastx Output" button) and upload the same at the "choose file" button. Once uploaded, the following tables will appear. These tables can be read similar to the Blastx results.
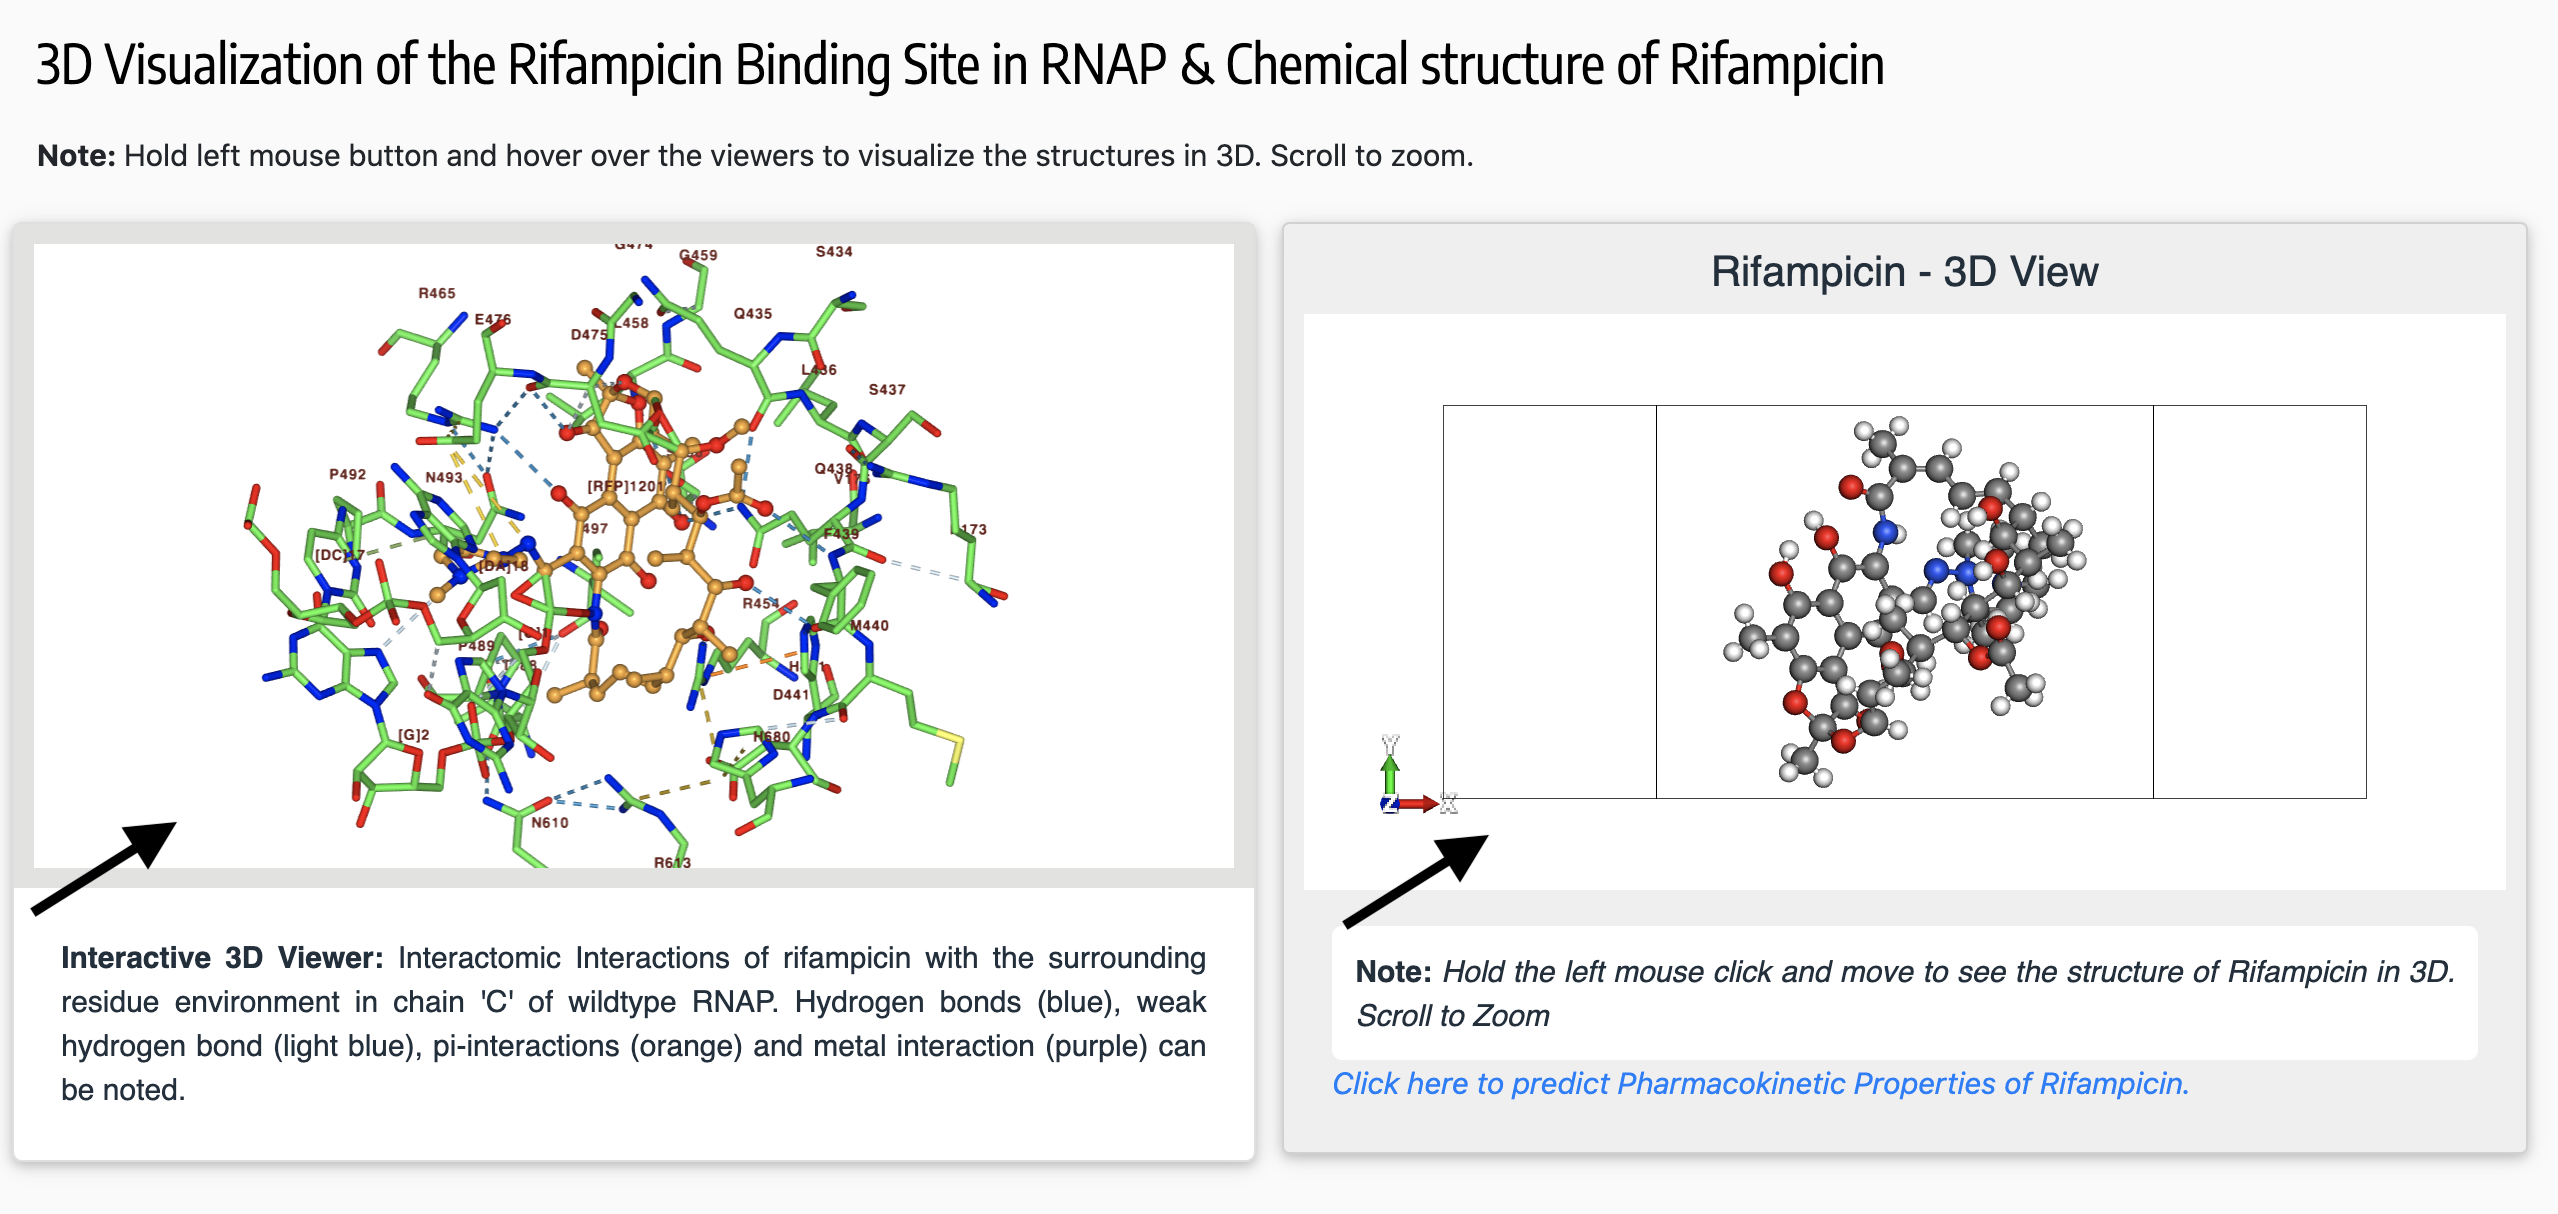
The viewports for 3D visualization enables the user to interactively view the binding site of the ligands (drugs) in their corresponding drug-targets. Only residues within 5Å from the ligand can be viewed using the NGL viewer panel on the left.
The mouse controls for the viewer are as follows:
- Scroll: Zoom scene
- Drag-right: Pan/translate scene
- Drag-left: Rotate scene
- drag-ctrl-right: Pan/translate hovered component
- drag-ctrl-left: Rotate hovered component
- HoverPick: Show Tooltip for hovered component element
The right side viewport panel is powered by Molview to view the chemical structure of the ligand.
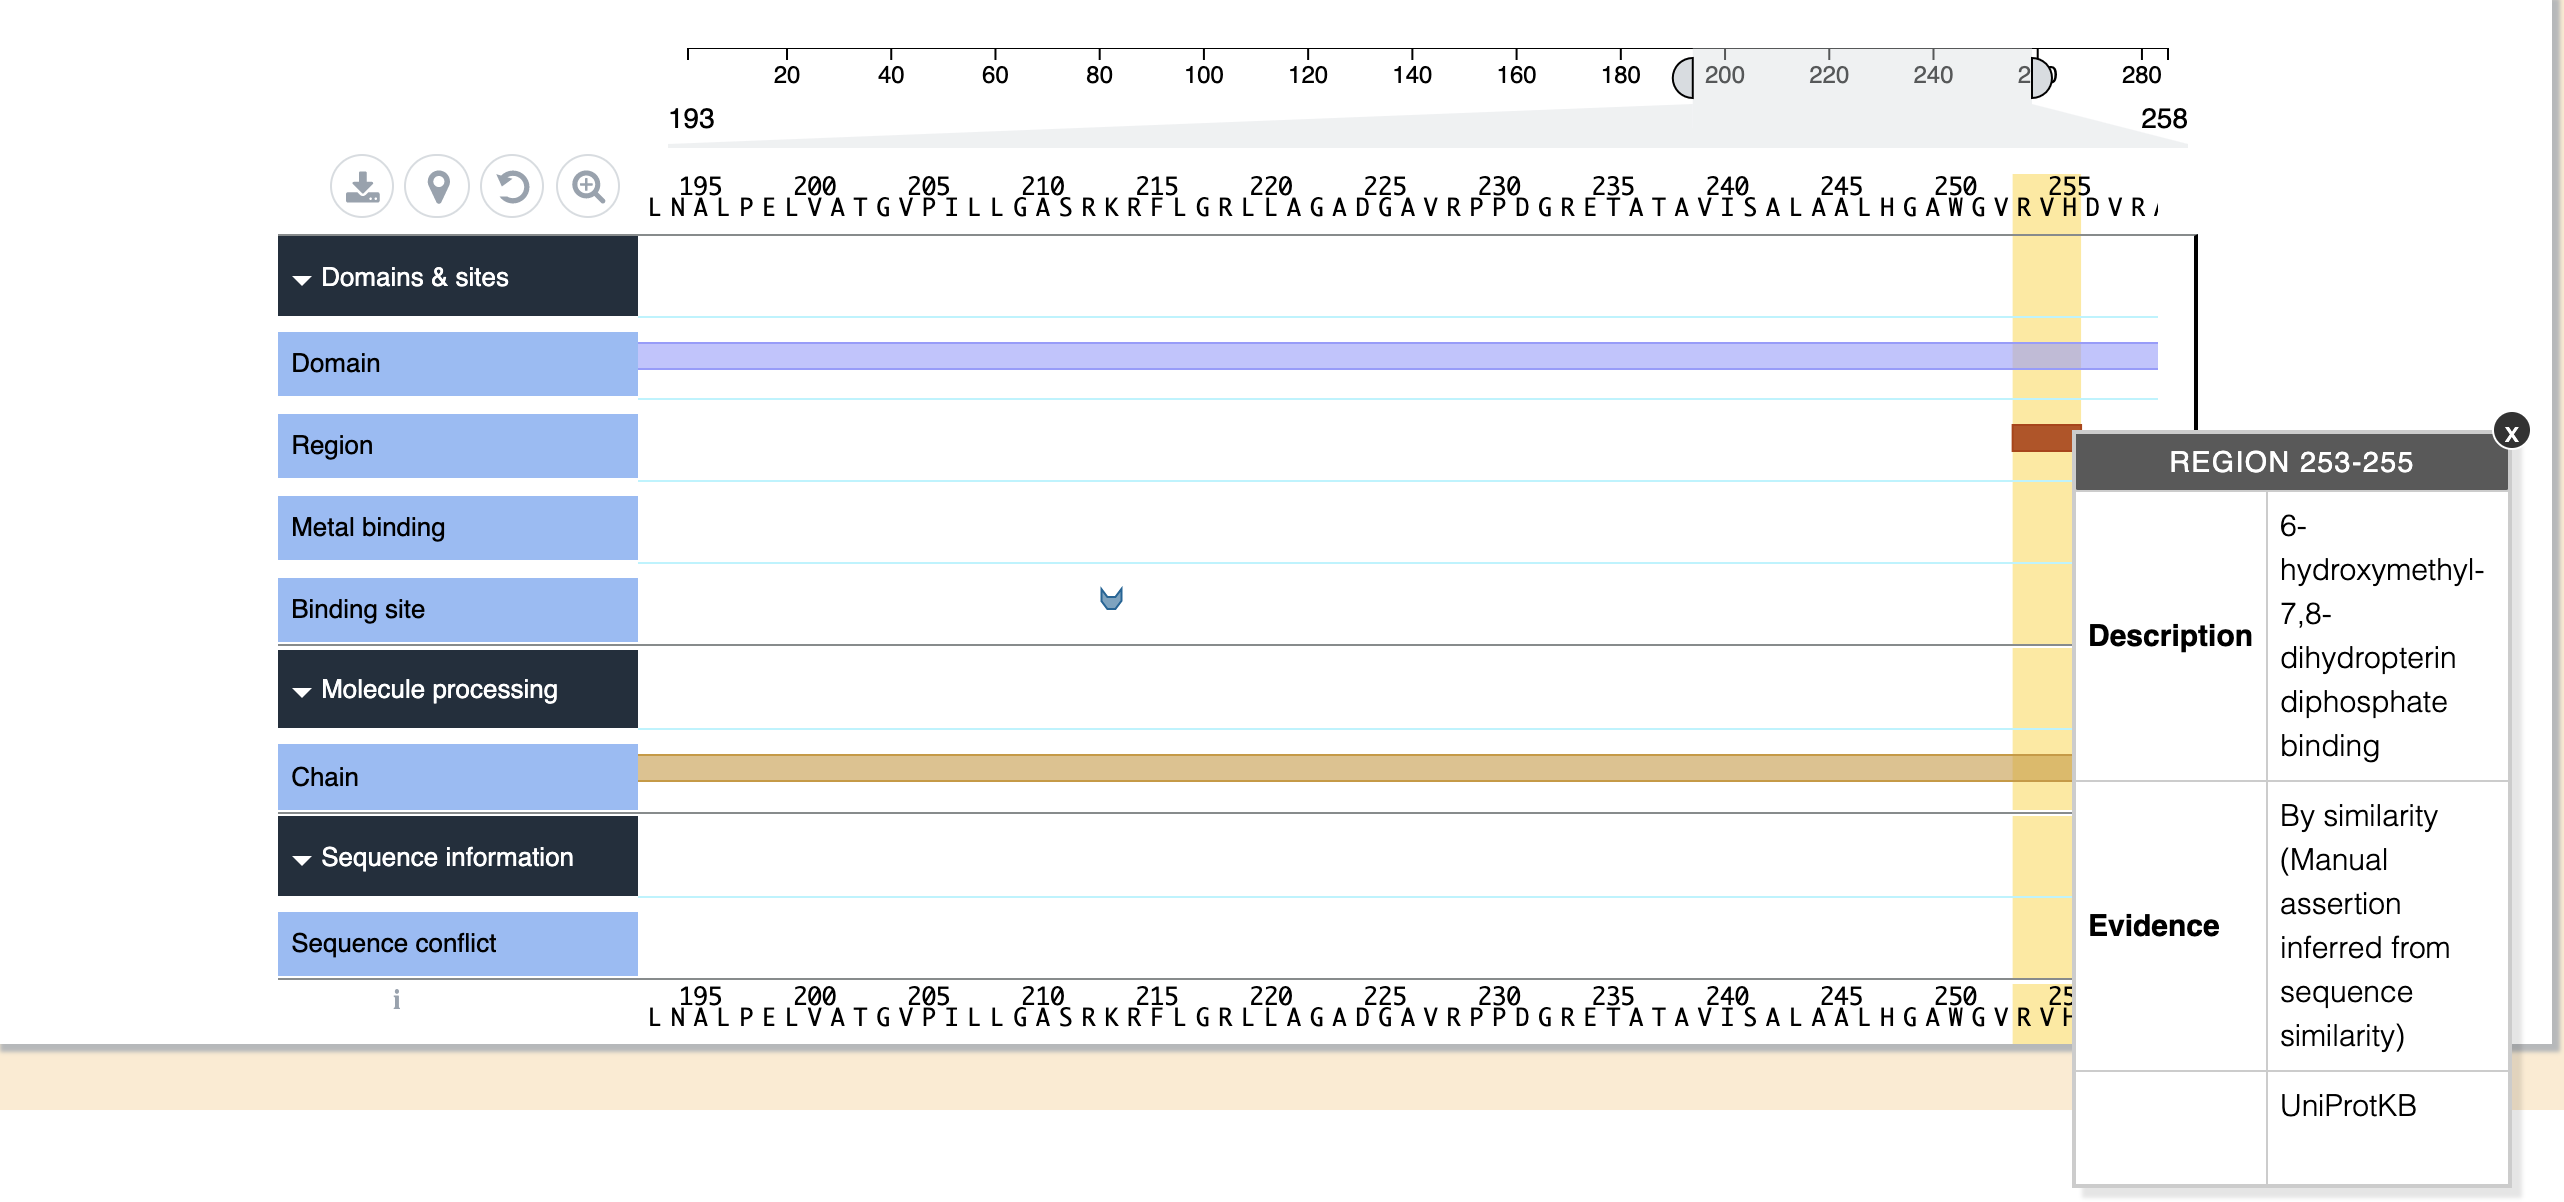
Protein Feature viewer presents protein sequence features in a highly interactive BioJS Component. Please see the Protein Feature Viewer website for more information. The sequence can be viewed by bringing the scale sliders together or by scrolling the mouse on the view container.
Interpretation of the Results: (Results of the Single and Systematic Mutation Form Submissions)
Overall Impact of the Mutations:
The overall impact of the mutation on the protein structure was calculated using consensus qualitative scoring metrics as follows:
I. The qualitative variables are scored as below:
| Property | Outcome |
|---|---|
| Residue characteristics of wildtype and mutant are the same (Eg: Aliphatic to aliphatic substitution) | Low Impact |
| Change in residue characteristic of the mutant (Eg: Aliphatic to aromatic substitution) | High Impact |
| Conservation score >= 0 (variable residue) (Measured by ConSurf) | Low Impact |
| Conservation score < 0 (conserved residue) | High Impact |
| Interface Residue = No (More than 5Å from the subunit interface) | Low Impact |
| If mutating residue is an interface residue (less than 5Å from the subunit interface) | High Impact |
| No change in secondary structure due to mutation (identified using SDM2) | Low Impact |
| Change in secondary structure due to mutation | High Impact |
| If the distance of the mutating residue from the ligand is < 5Å | High Impact |
| If the distance of the mutating residue from the ligand is > 5Å | Low Impact |
| If the distance of the mutating residue from the nucleic acid is < 5Å | High Impact |
| If the distance of the mutating residue from the nucleic acid is > 5Å | Low Impact |
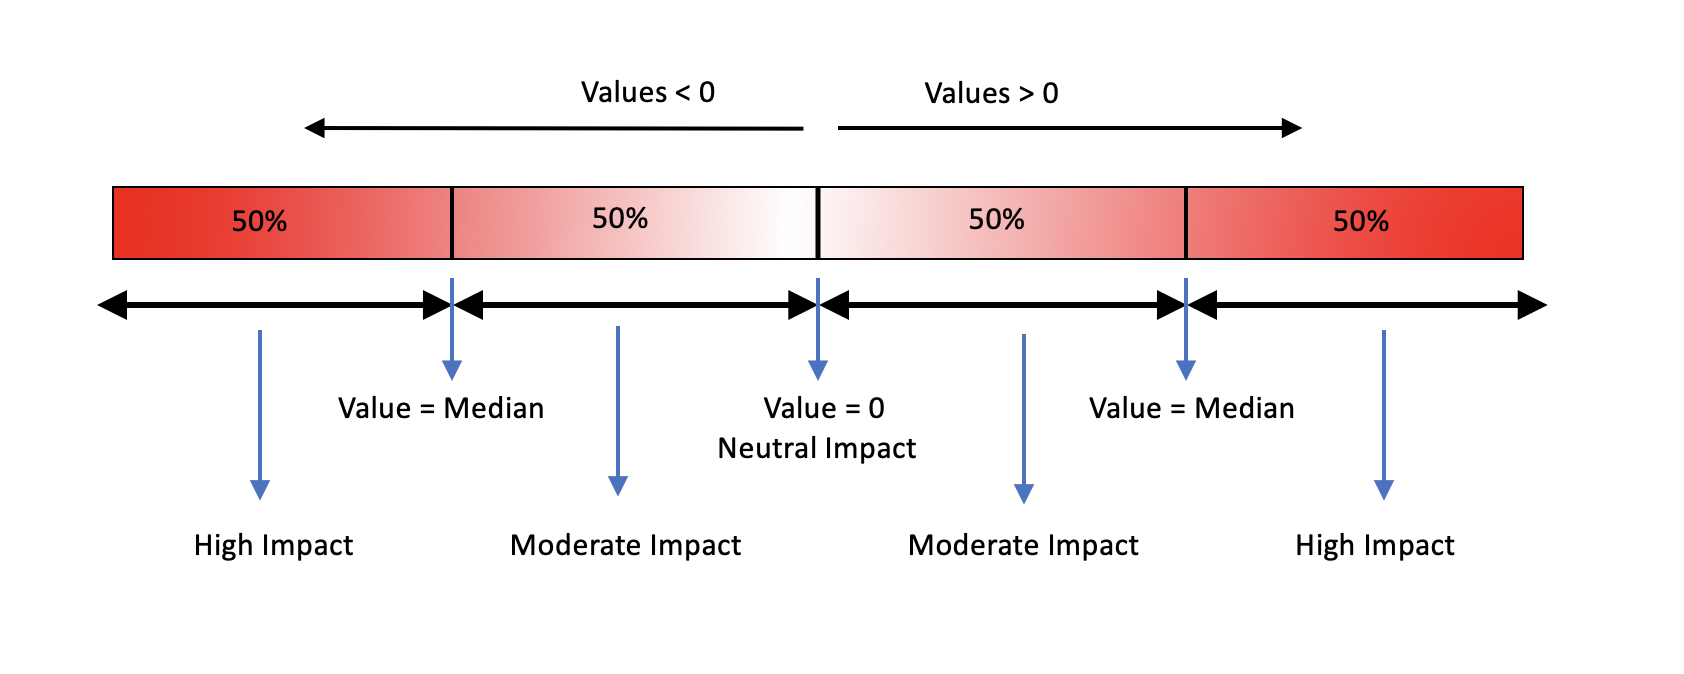
II. The following continuous variables are scored using the criteria shown in the figure below: (These values are calculated by SDM2)
- Difference in relative solvent accessibility between the wild type and the mutant residues.
- Difference in Depth of the wildtype and mutant residues.
- Difference in occluded packing density of the wildtype and the mutant residues.
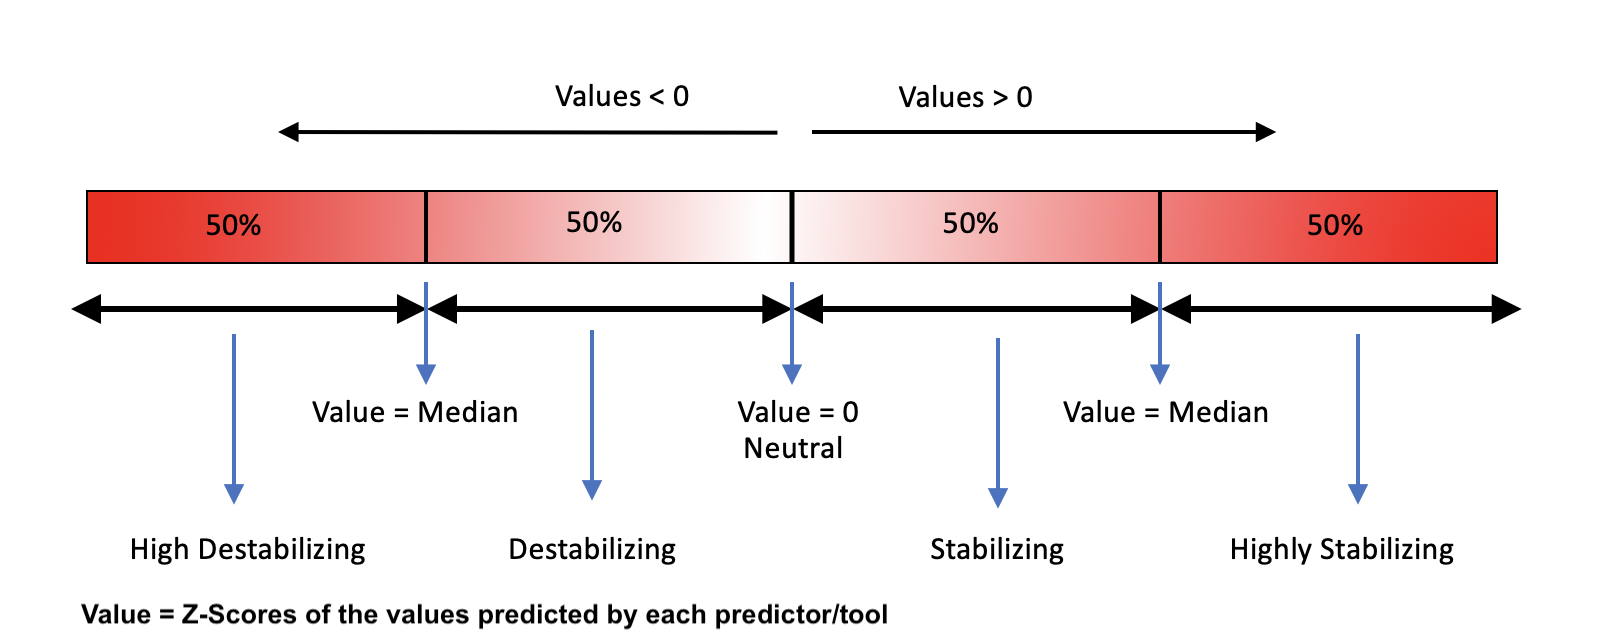
II. The predicted stability changes by following tools are scored using the criteria shown in the figure below:
- mCSM
- mCSM-PPI
- mCSM-NA
- SDM2
- Maestro
- FoldX
- DynaMut
III. For the following tools, the impact of mutation on protein stability changes was taken directly from the program outputs:
- PROVEAN (Neutral, Deleterious)
- CUPSAT (Stabilizing, Neutral, Destabilizing)
- CUPSAT Torsion (Unfavourable, Neutral, Favourable)
- IMutant-2 (structure) (Decrease, Increase)
- IMutant-2 (Sequence) (Decrease, Increase)
- EnCOM (Increased Molecular Flexibility, Decreased Molecular Flexibility)
Consensus Scoring:
I. Predicted Protein Thermal Stability and Affinity Terms:
The terms for decrease in stability are listed as below (each term has a score of 1):
1. Highly destabilizing
2. Destabilizing
3. Decrease
4. Deleterious
5. Increased Molecular Flexibility
6. Unfavourable
7. Reduced Stability
8. High Impact
9. Moderate Impact
The terms for increase in stability are listed as below (each term has a score of 1):
1. Highly stabilizing
2. Stabilizing
3. Increase
4. Neutral
5. Decreased Molecular Flexibility
6. Favourable
7. Increased Stability
8. Low Impact
9. Neutral
Overall score for each mutation = (Sum of destabilizing terms) - (Sum of stabilizing terms)
The overall score for each mutation within the drug target is then categorized as shown in the figure below:
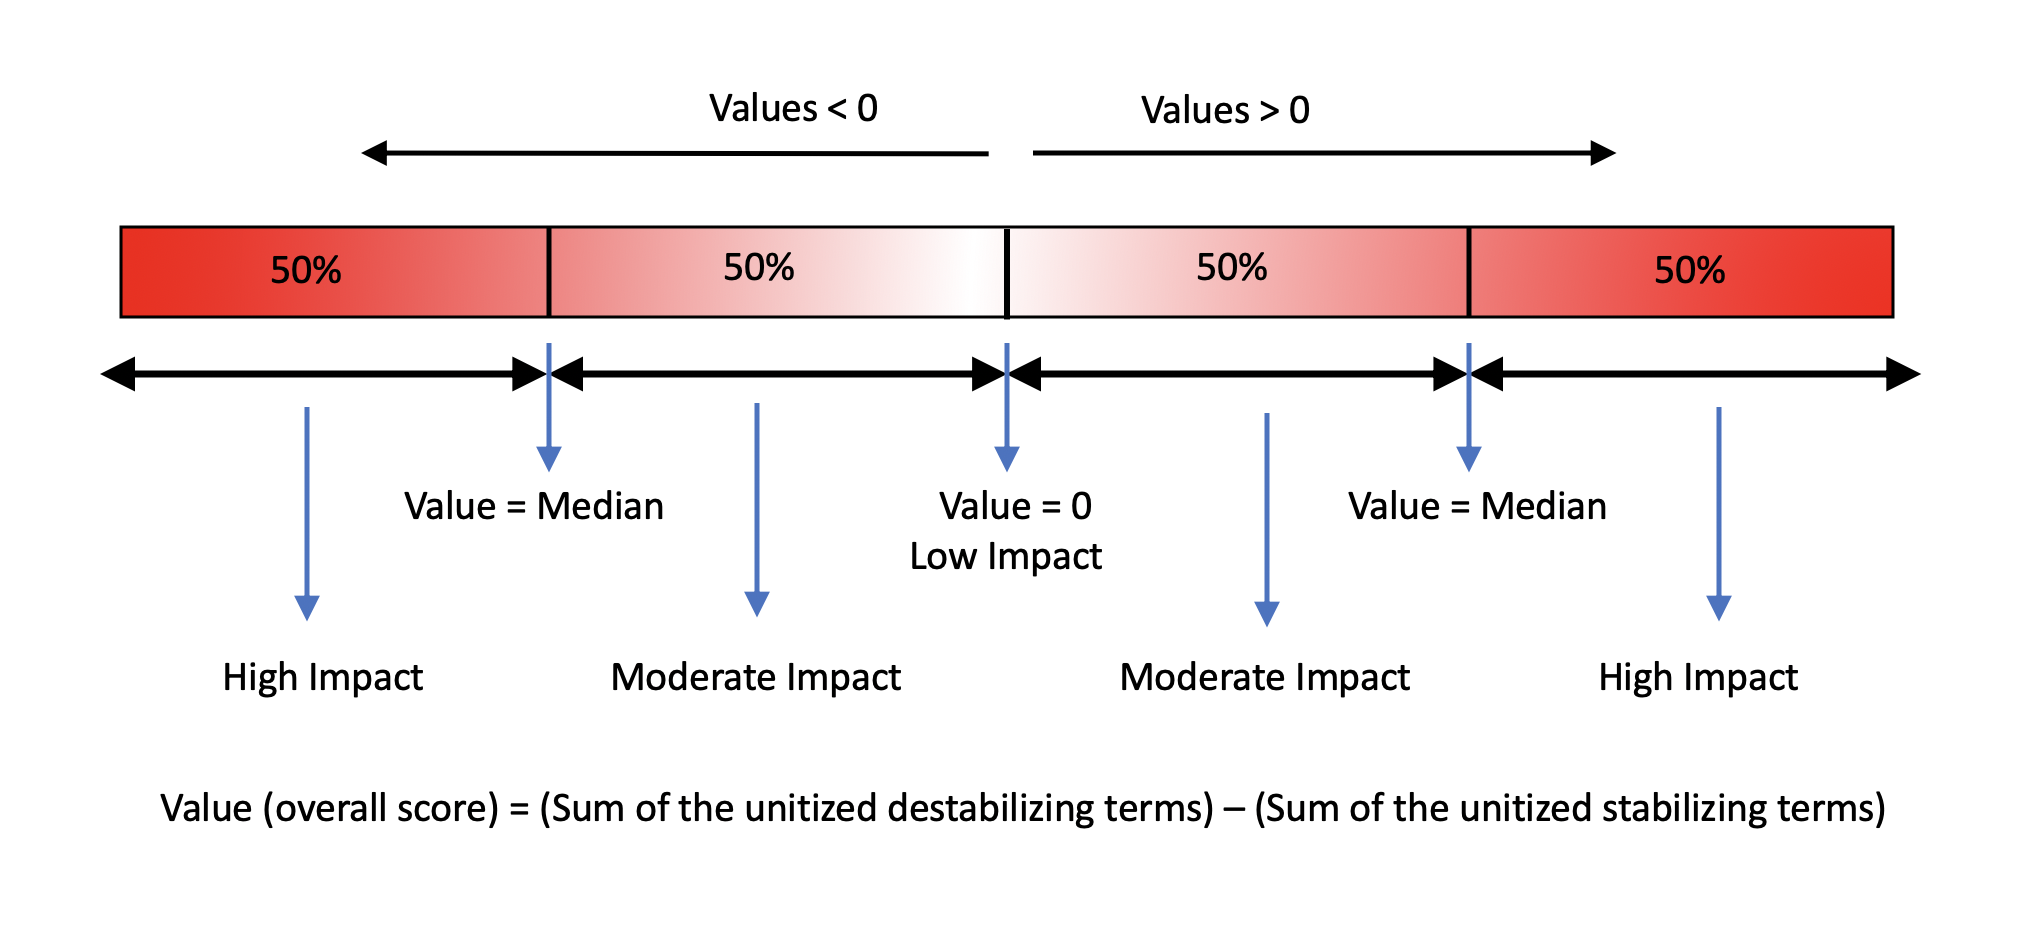
* Predictions from individual tools (shown above) for either single mutations or systematic mutations (all 19 possibilities) are shown in the results pages
Interactive Viewer:
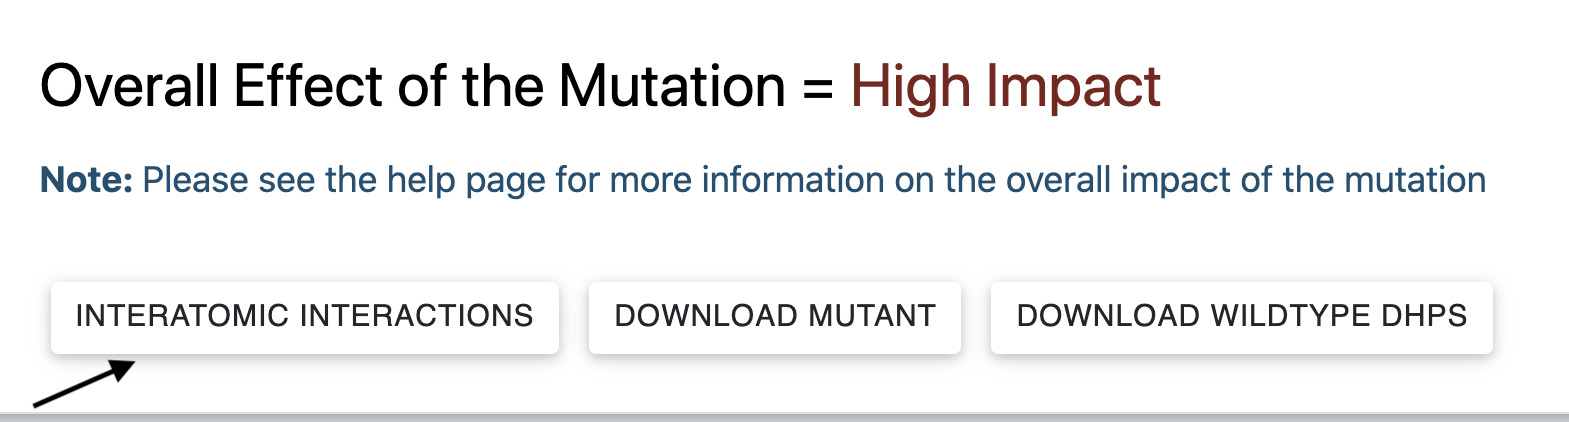
From the results page for single mutation queries, click on the "Interactive Interactions" button (figure below) to visualise the models of the wildtype and mutant proteins:
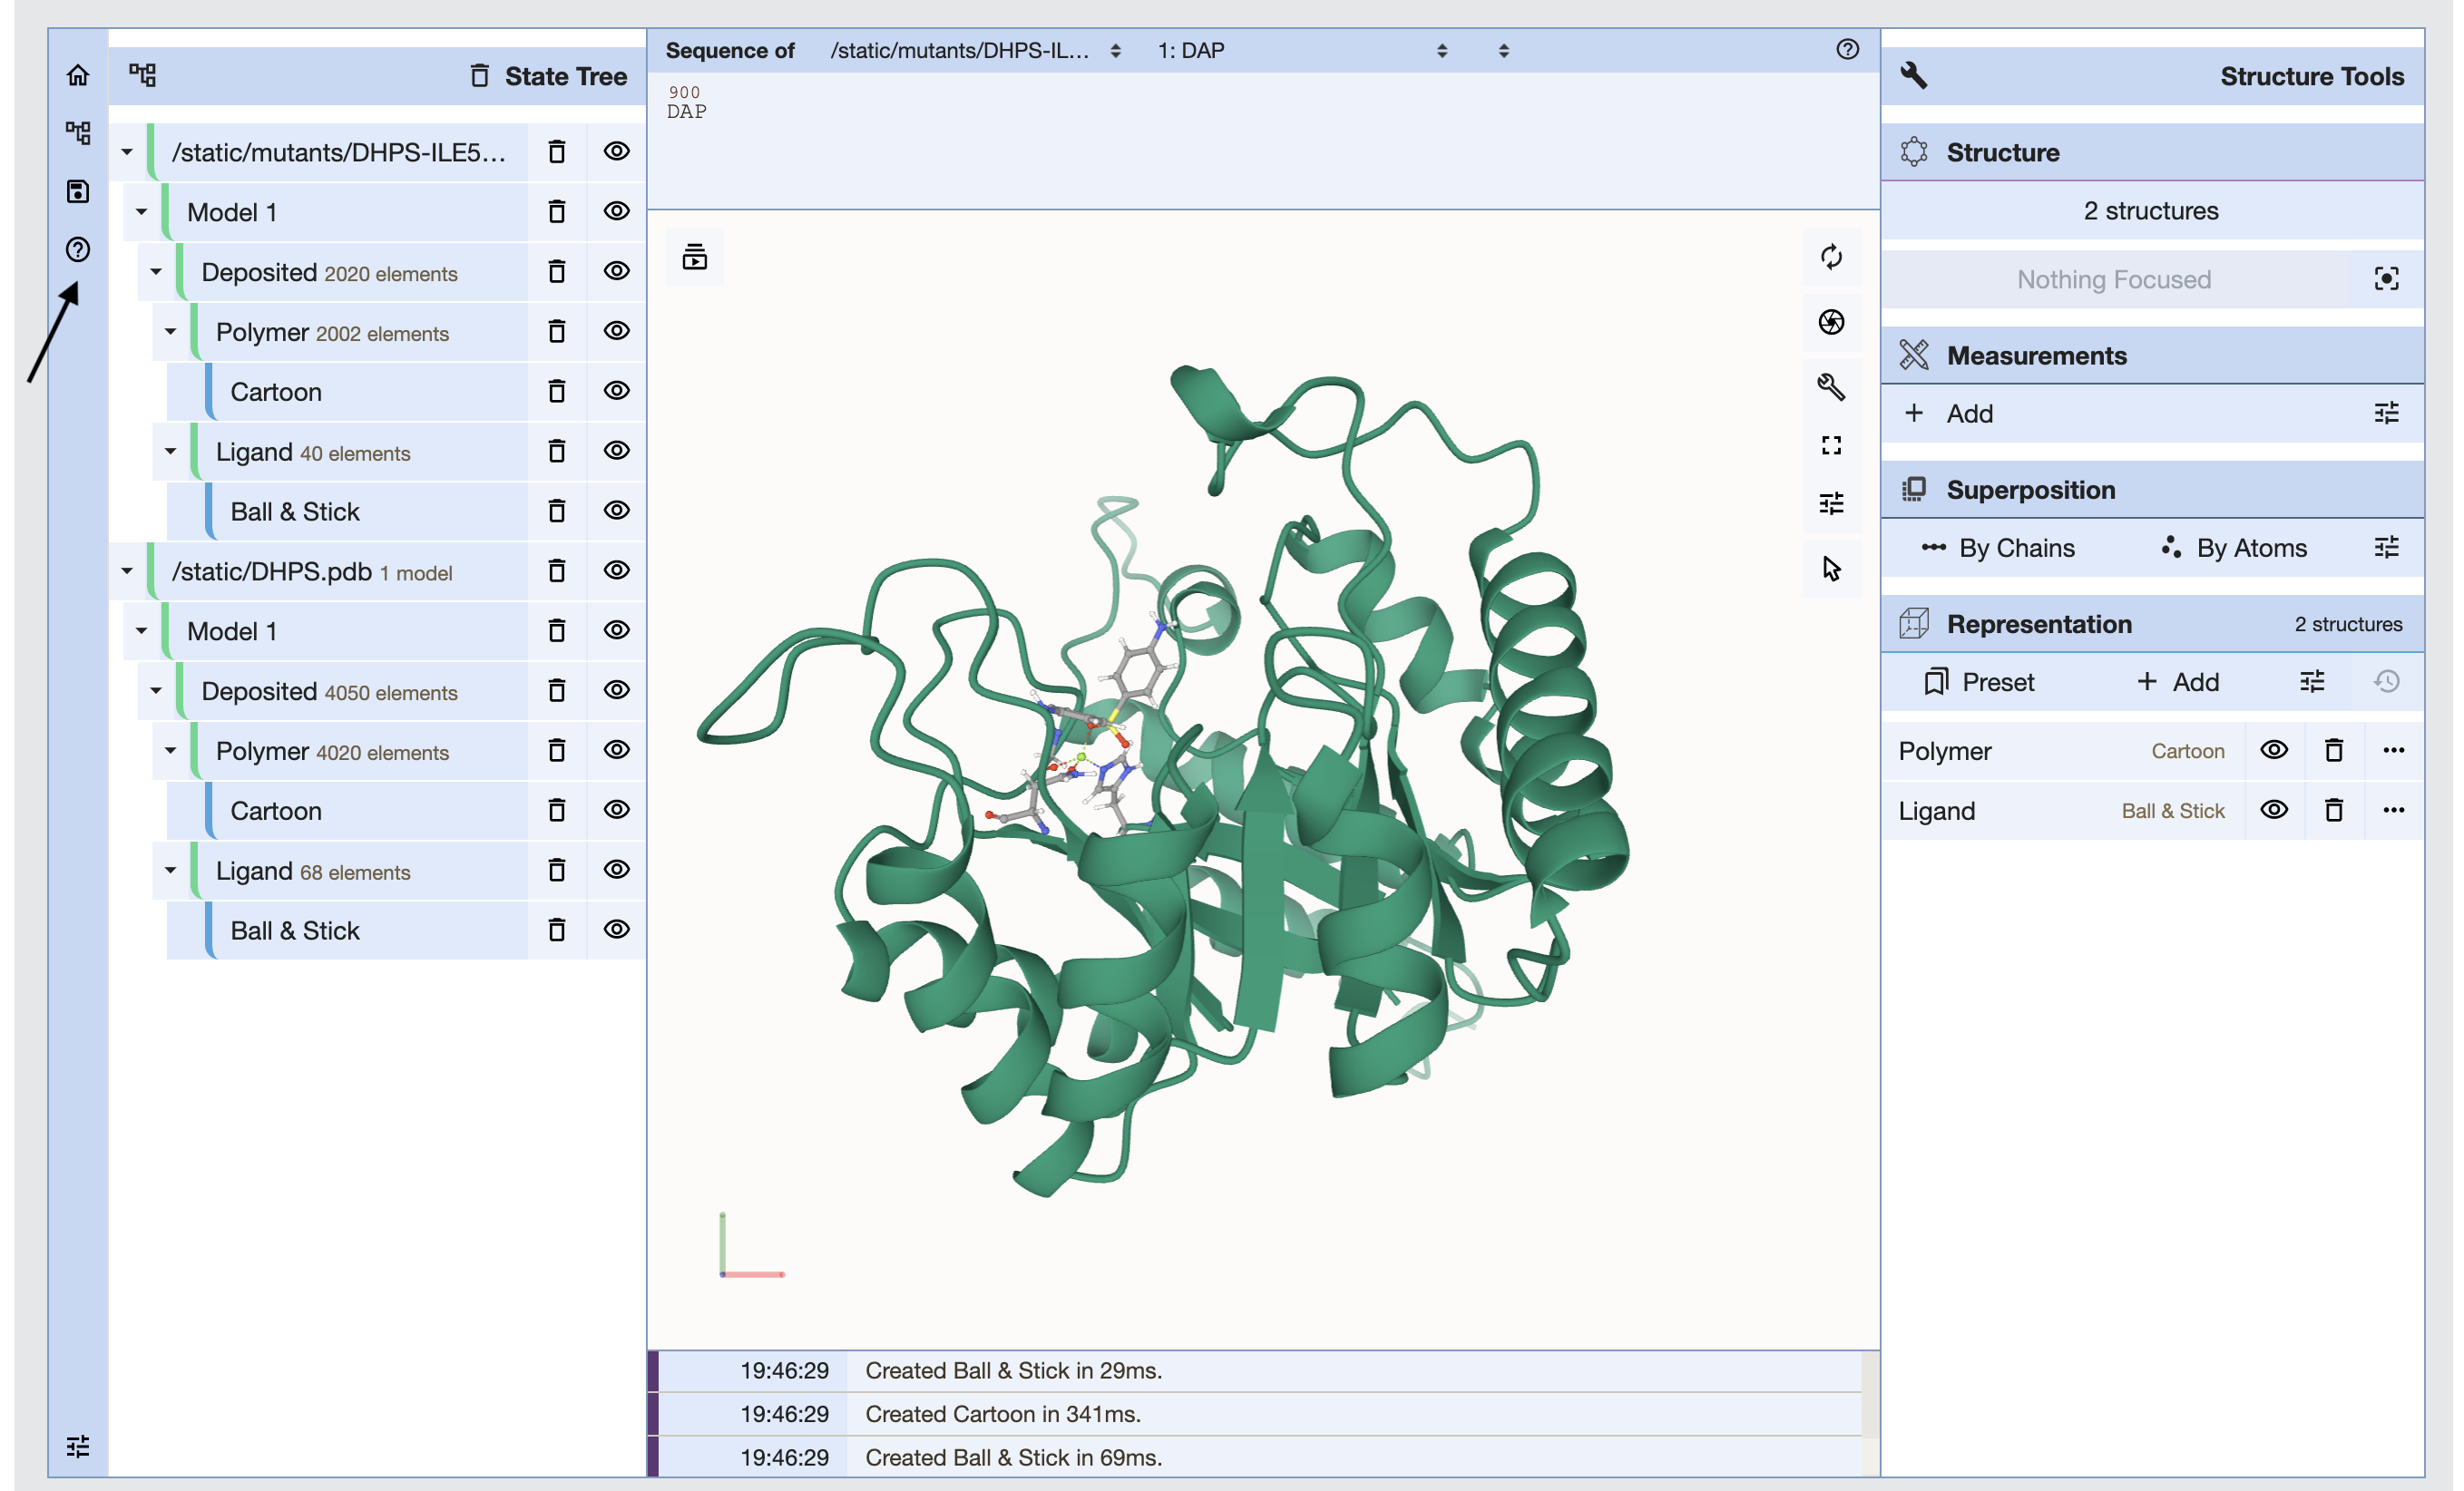
Molstar Viewer:
The molstar viewer is deployed from github repository and customized to meet the needs of the HARP visualizations. Both the wildtype and the mutant models are loaded by default in the viewer. Select the appropriate model from the icon on the left hand panel and toggle models by the clicking on the icon. Molstar enables visualization of protein structures in various representations and also helps in viewing interatomic interactions of the selected residues. In the figure below, the arrow points to the in-line help icon which provides guidance on using the Molstar viewer. Such icons are present in few other tabs in the viewer to help the user understand the functionality of various tabs in the viewer.
Interatomic Interactions:
Interatomic Interactions are calculated by Arpeggio, a web based tool to compute and visualize interatomic bonds within protein structures. User can download the interactions as comma-separated values (CSV) file.


HARP is a Leprosy Resource
